This posting is based on the theory that if you poke a sleeping bear hard enough, it may get very exciting for a short period of time. So this is me Poking the Nessus Bear.

Tenable talks about the adaptability and customisation that is available for customers that use the Nessus product. The availability of all their plugins to be easily readable by end users apparently is enough to allow their customers to create their own plugins for their specific environment requirements. In the case that customers need additional guidance on the NASL programming language, we are provided the NASL2 reference guide that was” recently” written in 2009. I am periodically disappointed when I get the urge to actually extend my Nessus scanner with a custom script and I go searching for updated references and documented samples in the hope that Tenable was finally helping the customers by providing real support for writing custom plugins.

  • Where is the documentation for the common functions/API’s used across plugins that have existed for a long period (e.g. smb*.inc)?
  • Where is the community forum dedicated to discussing NASL coding, and sample sharing?
  • Where is the community plugin repository so we can effectively share plugins that may be useful, but are not included in the standard product?
  • Where is the real capability to produce output that can be ingested as input into other scripts and programs (aka Unix PIPEs style)?
  • Where are the blog posts that walk through example plugin’s and what each part of the NASL script does?

Am I being antagonistic towards Tenable with the introduction to this blog. Yes, but remember I am trying to poke the Nessus Bear in the hope things may get exciting.

If you are a customer and have the same frustrations then let Tenable know. Yes I know they are a business, and they will focus on what is important to their customers. However, they need to know its important. One thought is if you agree some of my frustrations then you could log a support call with the subject (exactly) as “Poking the Nessus Bear”, and add any personal comments in the body. By using the same subject line, then Tenable can easily prioritise the call as a non-operational impacting call, but can also easily gather statistics on the numbers. The last thing I would advocate is causing a disruption to Tenable’s ability to support its customers.

Its very easy to post a blog entry and complain about what’s wrong without offering anything back to try improve the situation. So, in the hope to increase the NASL knowledge in the community I will attempt to document one of my custom NASL scripts in a way that may be useful as a reference to those who wish to try their hand at NASL.

The NASL script that I am going to use was created to read the registry of the scanned computers and print out the Services that are configured to run. This was to make it easier to check suspected infected computers to see if an unknown Service was configured during an infection event. Due to write permissions, you will find that many malware if they configure a new service will not try install itself in the %SYSTEMROOT%. Therefore, in the output of the script I separate the services into those services loaded outside of %SYSTEMROOT% and those installed in %SYSTEMROOT%.

Onto the meat of the script. I will skip over quickly the preamble of the script as this is one part that is defined by the available documentation on NASL writing.
#
#

include(“compat.inc”);

if(description)
{
 script_id(95001);
 script_version (“$Revision: 1.40 $”);

 script_name(english:”Malware – Microsoft Windows SMB Service Enumeration”);
 script_set_attribute(attribute:”synopsis”, value:”It is possible to enumerate remote services.” );
 script_set_attribute(attribute:”description”, value: “This plugin implements the SvcOpenSCManager() and SvcEnumServices() calls to obtain, using the SMB protocol, the list of active and inactive services of the remote host. An attacker may use this feature to gain better knowledge of the remote host.” );
 script_set_attribute(attribute:”solution”, value: “To prevent the listing of the services for being obtained, you should either have tight login restrictions, so that only trusted users can access your host, and/or you should filter incoming traffic to this port.” );
 script_set_attribute(attribute:”cvss_vector”, value: “CVSS2#AV:N/AC:H/Au:N/C:P/I:N/A:N” );

 script_set_attribute(attribute:”plugin_publication_date”, value: “2011/05/26”);
 script_cvs_date(“$Date: 2011/05/26 18:32:20 $”);
script_set_attribute(attribute:”plugin_type”, value:”local”);
script_end_attributes();

 script_summary(english:”Enumerates the list of remote services”);
 script_category(ACT_GATHER_INFO);
 script_copyright(english:”This script is Copyright (C) 2000-2011 Tenable Network Security, Inc.”);
 script_family(english:”Windows”);
 script_dependencies(“netbios_name_get.nasl”, “smb_login.nasl”, “smb_registry_access.nasl”);
 script_require_keys(“SMB/transport”, “SMB/name”, “SMB/login”, “SMB/password”, “SMB/registry_access”);
 script_require_ports(139, 445);
 exit(0);
}

Some quick points on the preamble. Unlike what is documented, instead of using a script_id in the 50000 range I have added one above 95000. This is a good indication of how out of date the NASL documentation is. There are more than 50000 Tenable supplied plug-ins now. It would be nice to see the script_id keyspace to be increased by a power of 10. Then we can have something like 0-500,000 reserved for Tenable, 500,000-900,000 for community shared script_id’s, and 900,000+ private use only.

Some of the other attributes I did not change or update from the plug-in script I used as a base. In regards to the script_require_keys, this sets the required KB items to run in optimized mode. The problem is there is no overarching description on what the KnowledgeBase is, how it is expected to be used, and what are the naming conventions. If there are standard KB keys used, then when writing new scripts we can make sure we don’t pollute the KB namespace with similar/duplicate keys. The more the community shares NASL scripts, the bigger the issue this would be. This leads to another question. What exactly is optimized mode?

All other parts are documented in the NASL2 reference.

In the next section of my script I include smb_func.inc. This is a file that references a number of other files that define useful SMB protocol functions. These SMB functions are used for checks, and setting variables before starting the core of the script. Most of the functions are named so it is easy to understand what their purpose is. In order, my script will set the “port” variable, check if remote machine is Samba based, set the “name” variable to the SMB machine name, set the “login” and “password” variables and Windows domain to the “dom” variable. Most of the SMB functions used are actually defined in the “smb_internals.inc” file, which is included by “smb_func.inc”.

(NOTE: you will have to have a professional feed to have access to the *.inc function/api files I discuss in this post)

Interestingly, while the included SMB functions are loaded by including the “smb_func.inc” file, all the KB items that are used in the functions (e.g. SMB/domain) are set when “netbios_name_get.nasl” and “smb_login.nasl” are initially run by setting the script_dependencies in the preamble above.

include(“smb_func.inc”);

port = kb_smb_transport();
if(!port)port = 139;

# Does not work against Samba
smb = get_kb_item(“SMB/samba”);
if(smb)exit(0);

name = kb_smb_name();
if(!name)return(FALSE);

if(!get_port_state(port))return(FALSE);

login = kb_smb_login();
pass  = kb_smb_password();
if(!login)login = “”;
if(!pass) pass = “”;

dom = kb_smb_domain();

The next section of the script opens a socket to the tcp port that was set using  “port = kb_smb_transport();” the open_sock_tcp function is described in the NASL2 reference document. The “session_init” and “NetUseAdd” functions are defined when “smb_func.inc” is included in the script earlier. Specifically the “session_init” function is defined in the file “smb_internals.inc” and the “NetUseAdd” function is defined in “smb_net.inc”.The purpose of this section of the script is to establish a SMB session to the target host.

soc = open_sock_tcp(port);
if(!soc)exit(0);

session_init (socket:soc,hostname:name);
ret = NetUseAdd (login:login, password:pass, domain:dom, share:”IPC$”);
if (ret != 1)
{
 close (soc);
 exit (0);
}

In the next section of the script we establish a connecting to SC Manager so that we can pull down a list of ACTIVE services running. The list of active services is then recorded into an array called “active_list”.  The functions used to open a connection to the SC manager and then enumerate the service were defined when “smb_func.inc” was included. The “OpenSCManager” and “EnumServicesStatus” are specifically defined in “smb_svc.inc” file.

handle = OpenSCManager (access_mode:SC_MANAGER_ENUMERATE_SERVICE);
if (isnull (handle))
{
 NetUseDel();
 exit (0);
}

active_list = EnumServicesStatus (handle:handle, type:SERVICE_WIN32, state:SERVICE_ACTIVE);
CloseServiceHandle (handle:handle);

if (isnull (active_list))
  exit (1, “No services were detected.”);

This is the last bit of code used to prepare the main foreach loop that does most of the work. First we set up 4 variables that will be used later in the script. The “services” variable will be used at the end to hold the results we want printed out as a “security_note”. The variables “active_services” and “non_sys32_services” respectively will be used to hold services found in System32 directory and those outside. I should rename “active_services” as the name was set as part of the evolution of the script development and I did not get around to change it to be more reflective of its current purpose. Finally we have a variable “is_sys32_dir” that will be used in the foreach loop to determine if the service details have components outside the System32 directory.

In the second part of the following section of code we set a variable that is used to reference an open registry connection to the LOCAL_MACHINE hive of the remote machine. The “RegConnectRegistry” function was defined with the inclusion of “smb_func.inc” and its definition is specifically found in the “smb_reg.inc” file.

services = NULL;
active_services = NULL;
non_sys32_services = NULL;
is_sys32_dir = 0;

#Connect to the remote registry using the open SMB Session
hklm = RegConnectRegistry(hkey:HKEY_LOCAL_MACHINE);
if ( isnull(hklm) )
{
 NetUseDel();
 exit(0);
}

We are now at the core of the script were we loop across each ACTIVE service that was recorded in the array “active_list” earlier in the code. The variable “temp_services” will be used to hold output information in the loop that will be appended to either the “active_services” or “non_sys32_services” variables for final script output. We set the is_sys32_dir to zero at the start of each parse through the loop. The “GetService” function, which is defined in the file “smb_svc.inc”,  returns an array of information on a given service which is stored in the array “parse” for the script. We only use the first two elements of the returned array from “GetService”, with the first index (0) being the service name from the SC manager, and the second index (1) the returned service description.

The other variables are used for the registry lookups. The “regdll” and “Imagenm” variables are used to hold the returned values from the registry queries the script does, and the key1/2 and item1/2 define the specific registry keys and values that we want queried.

foreach elem (active_list)
{
 temp_services = NULL;
 is_sys32_dir = 0;
 parse = GetService (service:elem);
 regdll = NULL;
 Imagenm = NULL;
 temp_services = parse[1] + ” [ ” + parse[0] + ‘ ] ‘;
 key1 = “SYSTEM\CurrentControlSet\Services\” + parse[0] ;
 item1 = “ImagePath”;
 key2 = “SYSTEM\CurrentControlSet\Services\” + parse[0] +”\Parameters”;
 item2 = “ServiceDll”;

This is where we finally query the remote machine for the registry details for the active services. We open two of the registry keys as defined in key1 and key2, and then query for the respective values. The key registry functions “RegOpenKey” and “RegQueryValue” are defined in the file “smb_reg.inc”.

In the first registry query we are looking for the queried services ImagePath. This is the executable that holds the service code. If the ImagePath contains “ystem32” (i.e. System32 service),  then we set the “is_sys32_dir”. Similarly in the second registry query the active service is checked to see if there is an associated ServiceDll. If a ServiceDll is found, then it is checked to determine if the path of the DLL is within the System32 directory or not.

key_h = RegOpenKey(handle:hklm, key:key1, mode:MAXIMUM_ALLOWED);
if ( ! isnull(key_h) )
{
    Imagenm = RegQueryValue(handle:key_h, item:item1);
    if (!isnull (Imagenm))    temp_services += ‘\n\t’ + “ImagePath:” + Imagenm[1];
    if (“ystem32” >< Imagenm[1]) is_sys32_dir = 1;
    RegCloseKey (handle:key_h);
}

key_h = RegOpenKey(handle:hklm, key:key2, mode:MAXIMUM_ALLOWED);
if ( ! isnull(key_h) )
{
    regdll = RegQueryValue(handle:key_h, item:item2);
    if (!isnull (regdll)) temp_services += ‘\n\t’ + “ServiceDLL:” + regdll[1];
    # if imagename has not been set and regdll is in system32
    if ((‘ystem32’ >< regdll[1]) && !Imagenm[1])
            is_sys32_dir = 1;

    # Else if ImageName is set, and regdll not in system32 unset
    if ( !isnull(regdll[1]) && !(‘ystem32’ >< regdll[1]))
            is_sys32_dir = 0;
    RegCloseKey (handle:key_h);
}

This is the last part of the main foreach loop where we assign what we held in the variable “temp_services” to the variables “non_sys32_services” or “active_services” depending on if the “is_sys32_dir” was set or not. The reason we keep the services separate is so that we can print them out separately depending on their location.

I also have created two new KB items that will record that the service as being active and the service display_name. This is where it would be nice to have some guidance and structure around the KB namespace. I am sure as people write their own scripts and create KB’s, that referencing those KB’s in other scripts would be helpful.

temp_services += ‘\n\n’;
if ( is_sys32_dir == 0 )
    {
        non_sys32_services += temp_services;
    }
    else
    {
        active_services += temp_services;
    }
set_kb_item(name:”SMB/svc/” + parse[0], value:SERVICE_ACTIVE);
set_kb_item(name:”SMB/svc/” + parse[0] + “/display_name”, value:parse[1]);
}
# end of foreach elem (active_list)

NetUseDel ();

And finally we get to the end of the script. Here the “services” variable is set up ready to print the output to for the nessus report using a “security_note” at the end. As per the NASL2 reference document, a security_note is used to report miscellaneous information. Also, a new KB is created that will dump a list of all the active services and their registry details.

 if (max_index(active_list) > 0 )
{
    services += ‘\nActive NON System32 Services :\n\n’ + non_sys32_services;
    services += ‘\n\nActive System32 Services :\n\n’ + active_services;
    fullsrv = active_services + non_sys32_services;
    set_kb_item(name:”SMB/svcs/all”, value:fullsrv);
}

if(services)
 security_note(extra: services, port:port);

#end of script

I have been thinking that in the future I may be able to define a variable based on a policy file. Then depending on the variable I can modify the layout of the information printed by the security_note(). If I want a script to parse output at scan completion, then I could have a variable set and maybe print out a common separated list of services and details, or a name=value pair. What would be even better is if there was another function to store machine parsable output in the Nessus core library. This may mean in the final .nessus report we would only have to look for our section, or potentially we can call nessus from the  command line with an option to only print the machine parsable output.

Since posting my previous blog entry a couple of weeks ago I have been doing some research on how I could use the openPERT tool to improve the rigor of my selection of the metrics used in the FAIR methodology.  This comes after listening to the discussion in the RiskHose podcast 9 where it was discussed how to attribute an “expert” opinion into your metrics.

While I am no statistician, and I am only just started to read about PERT, Beta distributions and Monte Carlo simulations, I think I have obtained a base understanding of how they are used, especially in the normal context of project management. However ,I am grappling with how I can make use of these tools in the context of the FAIR risk methodology.  So, as a way to try draw out my thinking, I thought I would jot down my current thoughts and hope for some feedback/direction to determine if I am heading in the correct direction.

To ensure this post doesn’t turn into War and Peace, I will limit my thoughts to the initial FAIR metric selection of Threat Community capability. The FAIR Threat Community capability suggests five categories:-

Rating Description
Very High (VH) Top 2% when compared against the overall threat population
High (H) Top 16% when compared against the overall threat population
Moderate (M) Average skill and resources (between bottom 16% and top 16%)
Low (L) Bottom 16% when compared against the overall threat population
Very Low (VL)  Bottom 2% when compared against the overall threat population

The problem is, a particular generic Threat Community will be made up many smaller Threat Communities, each of which have their own capabilities. So, it would be hard to define a Threat Community, such as “Organised Crime”, as just having a High (H) threat capability.

I believe that you need to be able to justify any metric you use and it has to pass the “smell” test to the lay reader. That is, if a metric doesn’t “smell” right, then it will create doubt in the reader for the rest of the assessment.  Given the diversity of a Threat Community such as “Organised Crime”, I believed that their capabilities would range across Moderate (M) to Very High (VH).

Before going further it is probably best to further define the example Threat Community of “Organised Crime”. This Threat Community would be those criminals working as a group to misuse computer systems for the purpose of monetary or material gain. To better understand what potential Threat Vectors this Threat Community may use we can define the motivation even further to include:

  • Illegal Information Disclosure
  • Unauthorised Data Alteration
  • Fraud
  • Blackmail
  • Supporting Traditional Crime

When I wrote my original risk assessment I tried to visualise a Threat Community’s capability for the reader. To do this I displayed the metric using a chart with a coloured normal distribution curved such as:-

Medium_to_High

Other communities with more defined capabilities would be shown as the below.

High

Low

It was when I visualised a broad capability such as “Organised Crime” that I became uncomfortable with my capability choice. Basically, it didn’t “smell” right to me. While it is probably true that “Organised Crime” will have such a broad capability as a Threat Community, from an Medium to Large Enterprise point of view, there will be a large part of that Threat Community that would not be relevant. Both because Enterprises don’t meet specific sub-threat communities target or motivation, and also because the techniques used can be expected to be ineffective in an Enterprise environment (assuming firewalls, proxies with authentication, patching, anti-malware software etc ). This sub-threat community would be targeting “consumer” end users, and would need a much lower “force” to be applied due to the low control strengths of a “normal” home personal computer.

This is the point at which I had reached before I wrote my previous entry. While I was really satisfied with the results of using the FAIR methodology for doing a generic risk assessment, there were some areas that I wanted to introduce more rigor. This was especially around metrics that had a strong dependence on my “expert” opinion.

At this point I will attempt to use the openPert excel add-in to better display how a particular generic Threat Community may be applied in a context such as an Enterprise environment (NB: I am using the tool for the first time as I write this post). First some assumptions.

  • While we may see the less capable “consumerware” threats, because of the Enterprise environment we can assume they will be mitigated (and therefore will have little impact on the risk assessment).
  • As we move towards the High category, the force applied by the Threat Community will become more successful in the initial stages, but are more likely not to cause a significant impact to the business. This may be because the community ignores Enterprise environments as it is not their target, or because additional stages are ineffective to complete the community’s motivations. So we can set the minimum capability for our betaPERT calculation at 67% which is the middle between 50% and 84% (boundary for High).
  • The upper boundary will still be 100%, because it is likely that only the most capable of the “Organised Crime” community would target larger Enterprise environments.
  • Given the context of the Enterprise for a Medium to Large enterprise, the most likely capability to be successful would be 88%. This is just an initial estimate so that we can run a simulation and produce a distribution histogram from the openPERT tool

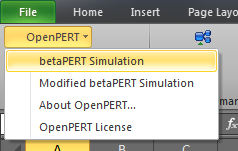
To make use of openPERT, we run Excel and from the Add-In menu select the betaPERT Simulation option

OpenPERT Excel Add-on

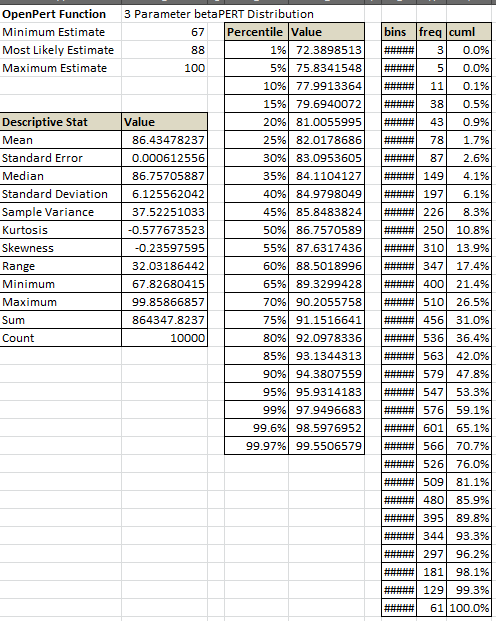
The betaPERT Simulation will ask you for a minimum, maximum and most likely estimate for your values. By entering the values from the assumptions above we get the following output.

BetaPERT Simulation Table

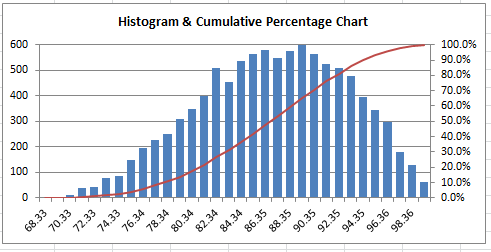
betaPERT Distribution

Having a look at these results we can see from the produced distribution that approximately 35% of the “Organised Crime” Threat Community would be considered to be of Moderate (M) capability. At the other end of the scale only 1% of the Threat Community would be estimated to have Very High (VH) capability.

Using the openPERT Add-in, the produced distribution starts to “smell” right to me. If we take it one step further I think we start to see more rigor added to the metrics used to feed into FAIR. That is, we use the betaPERT simulations to produce distributions for Threat Communities based on a particular “victim” context and then adjust again to take into account what we normally only see the Threat Communities of a certain capability make use of for a Threat Vector. For example, would we expect the most capable attacks (e.g. use of zero day exploits)  from “Organised Crime” to be using Spam as a Threat Vector.

So after writing all this I am left with the following questions in my mind.

  1. Does making use of the openPERT tool like this really add value to improve the rigor of the metrics used in a FAIR assessment?
  2. How do I present/visualise the difference between the general Threat Community (which was my first normal distribution graphic) with an adjust betaPERT distribution so that lay readers of any assessment can easily recognise the differences due to the risk assessments context.
  3. What other metrics should also make use of betaPERT simulations to add rigor, and then how do you calculate the intersection of two distributions in FAIR to produce distributions for Vulnerability and Loss Event Frequency. I have found the following article that gives advice on how this could be done: Why You Cannot Add Two PERT Estimates

Recently I decided to make use of the FAIR risk model to document how the threats have dramatically changed over the first 6 months of 2011. Besides always liking the concepts of the FAIR model, I thought the risk assessment paper I had to write would benefit with the focus on Threat Populations/Communities rather than using technology as a driver.

I don’t intend to try explain the FAIR methodology write as there is plenty of documentation on the model already, but I thought I would share some comments from my experience in using it. I am also sure that I am misusing some of the nomenclature used in FAIR, so I apologise for that up front.

The largest benefit in using the FAIR model was being able to show to the non technical managers that the increase in risk in 2011 was being driven by changes in the Threat Population profiles. That is, it was the increased activity by “assumed” Nation State, Hackers and Hackivist Threat Populations that was driving the increase risk and this could be shown without the need of having to focus on the specific techniques or vulnerabilities that were being utilised. By describing each Threat Population, their capabilities and their potential motivations I believe it allowed for greater acceptance of the outcomes. The non technical managers could better grasp the drivers, and therefore were more accepting of the assessment. Because the Threat Population profiles are unlikely to change significantly (i.e. who they are, what their capabilities and motivations are), I spent a lot of time carefully presenting each profile as an appendix to the assessment. This appendix can be used in future risk assessments and will allow continuity between assessments.

To better determine where changes may need to occur in the organisation, it was not enough to just rely on a high level assessment of how well we could resist the applied force from Threat Populations (sorry I am trying to use FAIR nomenclature). Therefore, each Threat Population was linked to common “groups” of Threat Vectors. It is the force applied through these Threat Vectors for each Threat Population, that allowed for a better overall picture of where changes to Control Strength would have to be applied. I also used these common Threat Vectors to individual show the Threat Event Frequency that is expected based on the motivation and capability of each Threat Population. This also means that some Threat Vectors would be not applicable as they are not normally use to achieve the Threat Populations motivation. Some of the vectors used were:

  • Targeted Email, Spam, Hosted Website, Website based (e.g. drive-by-download) ….

It is in the assessment of the Threat Vector’s Control Strength where I first deviated from the FAIR model. I found the use of an overall Control Strength assignment to be too generic, and it didn’t show where potential weaknesses were. Therefore I used Control Strength as a means to show the technology control strength and the strength of the configuration and policies applied to those technologies. Then I also created a new assessment for the “Time to Detect” an event. This second category shows what impact available people resources are and their ability to deter the forced applied by an event. It would also define the capabilities of those resources, as the more capable they are the more likely they would recognise an event occurring.

While the introduction of the new assessment category in the model work well to show weaknesses between technology and people (processes could be spread across both categories depending on the context of the assessment), how “Time to Detect” integrates into the final risk calculation posed a problem. In the end, I used it twice which I am still not comfortable with. However, my use was based on where I thought it effected the risk calculation. The first time I combined it with Control Strength to create a “Mitigation Strength” assessment which was used in the FAIR model instead of the traditional Control Strength. The second time I used it to influence the final Severity impact on the basis that shorter “Time to Detect” should work to minimise Severity of an event.

Investing the time to learn how to use the FAIR model was very beneficial, and I will be using it again in the future. Especially when I need to determine what strategic changes are need to address changes in risk. Do I need to add more technology controls (or modifications to the policies of existing controls) or is it due to a lack of resources and the addition of technology wouldn’t be sound without the resources to make use of the technology.

Besides defining how the “Time to Detect” attribute should be used in the risk calculation, I believe defining capability levels and descriptions to each Threat Vector would strengthen the assessment of a Threat Populations capability to make use of a Threat Vector to overcome the applied mitigations. In other words, there is a need to provide examples of what types of actions would imply a Threat Population’s capability is in the top 2% compared to the general Threat Population. For the Threat Vector of targeted email a Very High capability may have these attributes:-

  • Makes use of undocumented and unknown vulnerabilities in attachments or linked resources
  • Makes use of single use malware to avoid detection from any security controls protecting target
  • Has invested time in documenting the background of their target so as to create a believable social engineering engagement to trigger the exploit
  • May have compromised a targets “trusted” relationship (e.g. family or friends) to send the email to increase probability of exploit action being triggered.

In the last few days since starting to draft this blog, I have started to listen to the Risk Hose podcast. From some of the discussions on Monte Carlo simulations and PERT, and the openPERT project, I believe these can also be of great benefit in strengthening the definition of both a Threat Populations capability is, and what the Threat Event Frequency of a Threat Vector would be. Especially since due to the lack of data many times, these assignments are based on “expert” opinion.

Location

       HKCU\Software\Microsoft\Windows\CurrentVersion\Explorer\ComDlg32\OpenSaveMRU


Description of Keys

The Windows Operating System uses a common feature to help applications track and determine what content access requests (e.g. Files) has most recently been requested from with in the application. This is referred to as Most Recently Used which is abbreviated to the acronym of MRU. Most of this tracking information is stored in the registry hives in Windows under key names which contain the acronym MRU.


When using the Windows Operating System the ability to open and save content to the file system is normally done using the dialogue boxes provided by the Common Dialog library Comdlg32.dll. When using this feature for opening or saving files, this librarywill also record MRU details in the registry under the OpenSaveMRU key.


The Comdlg32.dllwill maintain the details of the files that were opened or saved using its common dialogue feature under a sub key of “*“. With in the OpenSaveMRU sub keys, the MRU values are maintained under alphabetic key names (i.e. a, b,c,d,e,) and the key name with the oldest MRU entry (i.e. The entry has not been used recently) will be reassigned to any new MRU value that is needed to be recorded. The order of the last use is maintained under the key name MRUList, with the most recently used entry keyname being first in the value followed directly by the next recently value without any deliminators(e.g. Jadefg, would indicated MRU under key name “j” was most recently used, followed by MRU held in keyname “a”, and so on).


The Comdlg32,dllwill also maintain separate sub keys of MRU lists based open the file extension of the content that was access through the open and saveAs dialogue boxes. Therefore, you may additional and older file MRU for files such as *.zip, *.mpg, etc under the specific sub keys.


Windows 7 changes
It seems that under Windows 7 (which probably means Vista also), the keyname has changed to OpenSavePidlMRU. Also, the key name as now numeric.


Of note, software developers can set a flag in their applications so that MRU information is not recorded by Comdlg32.dll in the registry hive under the OpenSaveMRU key. Also, the MRU feature for Comdlg32.dllcan be disabled by policy by setting the key

       HKCU\Software\Microsoft\Windows\CurrentVersion\Policies\Comdlg32\NoFileMRU = 1

(a value of 0 will enable it again)


FIRPP details

Forensics: The OpenSaveMRU offers a fantastic means for forensic investigators to determine what end users may have been opening and saving recently, and where they may have been saving that content, even if it has been deleted from the file system. You can also create a timeline of usage by analysing the LastWrite timestamp on the MRU keys to determine just when a file was last used via this mechanism.


As the majority of end users may be careful covering their track by deleting files and potentially clearing the Explorer history database, not many are aware of the tracking information that is recorded in the registry hives. If you find that an end user has used “history clearing/privacy” application (which is likely to remove the MRU information), do no forget to look at the registry hive snapshots recorded under the System Volume store. Most applications of this sort will not go to the length of analysing the snapshot hives.


Incident Response: Similar to the benefits to forensics, the OpenSaveMRU can provide an incident responder supporting evidence of historic use, that may support the theory of events that the responder is working under. Of even more value, it may provide additional clues that provide the responder an alternative theory of events, and therefore allow for a quicker remediation of the incident (i.e. An end user claims not to have installed any new software, but the *.exe subkey MRU shows an suspicious cracked executable was run). The file locations recorded in the MRU’s may be of support to an incident responder if it is found an file share was accessed that the “normal” end user did not access.


Pentest:The value of the OpenSaveMRU for the penetration tester (or Capture the Flag contestant) is that it offers clues to potentially important directories, and network shares that may contain sensitive information. Also, as network shares are recorded in the MRU’s, it offers infrastructure intelligence to the penetration tester as to what systems may also exist on the network, and what roles those systems play for the organisation.


Pivot:The OpenSaveMRU record values do store network file share information. Therefore, this data can be used as targets for as a basis to social engineer others to execute applications from a seemly safe location (i.e. An internal file share). This can be especially nasty with Metasploits new capability to encode the meterpeter into an existing application without breaking the functionality of that application. The OpenSaveMRU values can also be used to provide target information to determine if network shares are vulnerable, and therefore available for further pivoting.


TOOLS


LINKS


http://msdn.microsoft.com/en-us/library/aa372139(VS.85).aspx – NoMRU Policy


http://www.forensicfocus.com/index.php?name=Content&pid=73&page=8

http://blogs.sans.org/computer-forensics/2010/04/02/openrunsavemru-lastvisitedmru/

While on my travels to the US for securityBsides SF, RSA2010 and SANS2010 I have been thinking about writing a blog entry on how the data stored in Windows Registry’s can be used in the context of forensic investigations, incident response, penetration testing and as an extension of pen-testing, the art of pivoting mercilessly (as Ed Skious would say)

I hope to cover a number of registry keys in a series of posts. Each blog post will explain the use of the registry key in Windows and then hopefully I can then describe how the key be of use in each of the contexts outlined above. Finally I will try list any reference URLs and tools associated with these registry keys.

If anyone can come up with a better acronym than FIRPP I will happily change it, but I plan on calling it this going forward.


ShellBags

Location:

       HKEY_USERS\\Software\Microsoft\Windows\Shell
       HKEY_USERS\\Software\Microsoft\Windows\ShellNoRoam


Description of Key/s
:
Window uses the ShellBags to store information the display settings and Most Recently Used (MRU) information about individual folders that have been open or closed at least once in Windows Explorer. When recording information about remote folders the information will be stored under the “Shell” key while local folders will be record in the “ShellNoRoam”. The structure of both remote and local keys are identical.


Below the Shell/ShellNoRoam keys we have two subkeys labelled BagMRU and Bags. The BagMRU subkey as the name suggests, records the Most Recently Used folders opened or closed in Windows Explorer. It is this subkey where you can are able to identify the Bag’s to folder names. The main BagMRU key corresponds to the Desktop folder, and each numeric subkey represents a sub-folder (subdirectory) that was accessed below the Desktop folder.


In each numeric subkey you will find a “NodeSlot” key which links directly to a Bags key with its record folder display settings, and a MRUListEX which is used to record the MRU details of items in this key, with the left most 4 bytes representing the most recent item opened/closed.


FIRPP Details:-
Forensics: The analysis of a computers Shellbags can help forensic investigations determine historic usage of Windows Explorers and past folder usage (even ones that have been previous deleted). While this is not definate proof of wrong doing, it may help confirm the likelihood of suspected actions being undertaken, or provide helpful indicators that investigators can use to focus further analysis on the system. For example, a person may be suspected of copying company Intellectual Property onto a USB stick. By analysing the Shellbags you may find a folder on a low drive letter (e.g. E,F,G drive letter) with a BagMRU folder item called “Copy of CreditCards”. While it is not proof, it does support the suspicious that initialised the investigation. There are Registry LastWrite information on the keys in BagMRU time information that can be be utilise to support a more comprehensive incident timeline. There also is MAC time information recorded in each of the numeric Bag key values of the BagMRUs.


Incident Response: The use of ShellBag information may not be a key part of incident response given its limited store information. One scenario that I can think of is to analyse the Shell key (i.e. the key that stores remote Bags) to determine recently accessed network shares. This information may be of use in cases where malware is known to propergate by trying to spread infections across UNC shares. Therefore, you can use the ShellBag information to identify network shares that have recently been accessed by users but may not be part of a normally mapped drive.


Pentest: In a penetration test and/or a capture the flag scenario the analysis of Shellbags may provide you clues as to additional places to look for sensitive or required information. This could be especially useful in the remote Shellbags for identifying remote folders that are accessed from non-mapped network drives. This could potentially reduce the time required to identify sensitive documents.


Pivot: The idea of pivoting, is to use the already compromised machine (i.e. the machine you are analysing the registry) as a jumping point to launch additional penetration attacks on other systems. In the case of ShellBags, you can use the “Shell” key to identify additional network systems that may be used as targets for pivoting to.


TOOLS:-
MiTeC Registry Analyser (no longer available – last free version may be found via Google)
Paraben’s P2 Commander


LINKS:-

Sans Forensics – Shellbags Registry Forensics
Using Shellbag information to reconstruct user activities

Shellbag Format AnalysisMiTec Registry Analyser

Yesterday I found myself trying to work out why a remote machine had suddenly had its MRU keys and subkeys deleted. Unfortuately, or fortuately depending on how you want to look at it, there was nothing obvious so I had the excuse to “play”. When I started to look into the machine I was working off two potential scenarios. I had a malware infection or an end user who was trying to cover their tracks by using a 4″x2″ to clean the registry(deleting the whole LastVisitedMRU+OpenSaveMRU trees, and not just wiping the values is a fairly brutal approach).

Because the computer wasn’t giving up its secrets easily, I have ended up spending more time then normal working on the machine, instead of just getting the desktop team to re-image it. Let me just say, this is not a scenario where I needed to be careful to preserve evidence, its more a case of using forensic techniques for incident response. Plus, if I polluted the evidence, then it just meant I would send the box off to be rebuilt.

Since the machine was remote, and I didnt have the bandwidth to undertake a remote image, I went looking for a way to be able to grab the live registry to do some timeline anlaysis on. I had previous worked out the time window when the changes occurred by comparing System Restore snapshot hives. My googling led me to HD Moore’s blog post on “Exporting the Registry for Fun and Profit“.

When you use the SAVE option with reg.exe it will export the keys and save the output in the HIVE file format. From what I have seen so far, when it does the export it also preserves the lastwrite timestamp details on the keys and values also.

So now, if you want to do basic timeline analysis only on portions/key areas of a remote registry, you can use reg.exe SAVE to export a small section of the registry. Plus, its much quicker to download key areas of the registry hives when your bandwidth is limited.

Some keys areas may be:-

       reg.exe SAVE \HKLM\Software\Windows
       reg.exe SAVE \HKLM\System\CurrentControlSet\Services
       reg.exe SAVE \HKCU\Software\Windows

Some of the tools and techinques I have used for the first time on this machine were:-

analyzeMFT.py (extract filesystem info from the MFT table)

shellBag registry analysis

I thought I would end 2009 off with posting a couple of Windows command lines that I came up with a couple of months ago in the spirit of www.commandlinekungfu.com . I wanted a way from the command line to be able to search all the Window machines on a subnet and dump out the output to a log file for review. Using the command line below allowed me to identify any potential machines on a network that may need to be more closely reviewed for inappropriate content based on the OpenSaveMRU registry values.


The final command line that I created was:-


for /L %i in (1,1,254) do @ping -n 1 -w 1 10.1.1.%i | (find "TTL=12" >null && echo 10.1.1.%i) > live.txt & for /F %s in (live.txt) do @echo %s & for /F "skip=2 tokens=2 delims=\" %t in ('reg query \\%s\hku') do @reg query \\%s\hku\%t\Software\Microsoft\Windows\CurrentVersion\Explorer\ComDlg32\OpenSaveMRU /s


If we break this down into sections we first have:-


for /L %i in (1,1,254) do @ping -n 1 -w 1 10.1.1.%i | (find "TTL=12" >null && echo 10.1.1.%i) > live.txt


This performs a loop from 1 to 254, counting by 1’s, and storing the current count in the variable %i. For each loop I ping the associated IP in the subnet 10.1.1.. The output of the ping is piped to a find to command for a basic Windows fingerprint based on time-to-live value. If the find is TRUE and we can echo (which should always be true) the && should evaluate to TRUE and so the echo will be redirected into the working file “live.txt”. Note I am not appending to the text file, so each run through the loop will overwrite the previous IP.


The next nested “for” loop (which runs each time the main loops runs (so for each IP value)) due to the “&” is:-


for /F %s in (live.txt) do @echo %s


The for loop here is reading the current entries in “live.txt”, which should only be the current IP, and echo’s this value out again for the third nested “for” loop. I cant remember why I had to use a file to write and read the IP to get this working, but it may be just how I evolved the kungfu. It has been a couple of months and a 3 week holidays since I created it.


The final “for” loop (which again gets run for each IP value) is:-


for /F "skip=2 tokens=2 delims=\" %t in ('reg query \\%s\hku') do @reg query \\%s\hku\%t\Software\Microsoft\Windows\CurrentVersion\Explorer\ComDlg32\OpenSaveMRU /s


Here we are using the IP read from “live.txt” in the previous loop, and using it to perform a “reg query \\\\hku”. This will grab all the root keys in the Users registry HIVE. I grab each of the key names (which I believe are each of the User SID values) and store them in the variable %t, which then finally allows me to query for all over the OpenSaveMRU key values (/s will output all subkeys also) for that machine.

There are probably better ways to do this, but it works well. From this I have create a couple of other handy kungfu command lines based on the registry settings.


This one I gave to the server/desktop team for double checking that all PC’s had the correct WSUS settings (yes even though GPO’s are used):-


for /L %i in (1,1,255) do @ping -n 1 -w 1 10.1.1.%i | (find "TTL=12" >null && echo 10.1.1.%i) > live.txt & for /F %s in (live.txt) do @echo %s >> wsus-audit.txt & reg query \\%s\hklm\Software\policies\Microsoft\Windows\WindowsUpdate /v WUServer >> wsus-audit.txt


If you want to check for what is running on end users login, you can modify my OpenSaveMRU to instead look at the Run and RunOnce values which can be found at:-


HKLM\SOFTWARE\Microsoft\Windows\CurrentVersion\Run
HKLM\SOFTWARE\Microsoft\Windows\CurrentVersion\RunOnceEx
HKLM\SOFTWARE\Microsoft\Windows\CurrentVersion\RunOnce
HKCU\Software\Microsoft\Windows NT\CurrentVersion\Windows\Run


And that’s all for 2009.

This is the second and likely final post I will do on using Circos for an IT investigation. In the first part of my detailed overview of how I had used Circos, I overviewed the gathering of evidence, and then how that evidence was used to generate the initial Circos visualization. In this post, we will add the extra details step by step that resulted in my final graph.


The first thing we need to do is add the banding to each of the “Users” arc’s. The bands in Circos are defined using the configuration line:-


BAND [Parent CHROMOSOME] BAND-NAME BAND-NAME START-POS END-POS COLOR


Unlike other types of potential visualizations, my requirement is that a single band represents an email. So I needed to add a band configuration that was defined by 1 unit. This produced a band configuration as shown below which was appended to my karyotype file.


If we now run the Circos command again as was shown in part one with the new karyotype file we will end up with a visualization that now includes bands on each of the User’s arc’s.


We are now ready to start defining the links that show the which user sent which email and to who. To draw a line to to link two User segments together, you need to specify the co-ordinates of each end point under a common Link ID as per the following:-


LINKID [Parent 1 CHROMOSOME] StartCo-Ord EndCo-Ord

LINKID [Parent 2 CHROMOSOME] StartCo-Ord EndCo-Ord


When I was creating my link file, I went back to my original Excel spreadsheet and created a dedicated “link” worksheet to track all the connections. I sorted my Message summary worksheet (the first worksheet I used to record all the details of each message) by Message ID, and then by Sender. From there, I worked down my way down the rows by MessageID, adding the appropriate details into my “link” worksheet.


Making use of the fantastic flexibility of Circos, then I created separate link files for each “Sender”. This allowed me to use the link “Rules” option to define different link line formats (i.e. Color) to make it easier to determine who was the sender of an email and who was receiving.


The final part of the visualization was the add the outside histogram. In my previous posted I mentioned that I also recorded the Date/Time in the summary Excel worksheet for each MessageID. I created a new column in my excel spreadsheet and used this formula to determine the age in months since the email had been sent:-


=(YEAR(DATE(2009,10,1))-YEAR(H52))*12 + MONTH(DATE(2009,10,1)) – MONTH(H52)


Note: column H was where the Date time was recorded in the summary sheet.


I then created an additional column to divide the total number of months by 3 to define the age in quarters. I did it this way instead of modifying the original formula because I was playing around with the scale on the histogram to determine the best visual representation while still conveying meaning. To plot the histogram I had to define a plot file. I grouped both the sender and recipient together to ensure the histogram values were correct on either side of the link. The plot elements were defined in the file using the syntax:-


[Parent 1 CHROMOSOME] StartCo-Ord EndCo-Ord HISTOGRAM-Value

[Parent 2 CHROMOSOME] StartCo-Ord EndCo-Ord HISTOGRAM-Value


Once again while defining the histogram “plot” section in my Circos.conf file I made use of Circos’s rules. This time using 3 rules based on the histogram value to change the fill color. This allows people to quickly identify the more recent incidents versus older incidents. This helps, because if someone received a lot of inappropriate material only more than 12 months ago, it can be a different issue for HR than someone who has received a lot in the last 3 months.


As promised, I am posting a detailed overview of the steps I undertook to create the my Email investigation visualization using Circos that I wrote about here.


To help set the scene, the evidence used to generate the data files for the Circos configuration originated from a number of Exmerged (exported) Exchange mailboxes. These mailboxes were loaded into a copy of AccessData’s FTK v1.8 (sorry, but v2 really was bad for thumbnail high volume graphic analysis and v3 wasn’t released when I stared the investigation). Once the PST’s had been processed then I could use the Graphics tab and review the generated thumbnails of all images found to quickly identify inappropriate content and assign the attachments and the parent email to a bookmark. Once I had finished with the images, I then when back to the Overview tab and reviewed all the movie attachments and again bookmarked any identified material and its parent email. The benefit of the bookmark feature was that after I had analyzed all the Exmerged mailboxes and other content, I could access all the identified evidence in one place.


To prepare the Circos data files I made use of Microsoft Excel to store key information. Why Excel? Because it was handy and its easy to use if you need to sort data in different ways while you are trying to work out what you require. The key worksheet I used was a summary table of all the emails that I had marked as evidence. For each person that sent or was a recipient of an email, a row was created. This meant for most emails there were multiple rows of To/From pairs. To create the Circos configuration files the key columns of the summary table in Excel were:-


MessageID

This allowed me to track a common email that went to numerous people. If with in the body of the email it could be seen that the content had been forwarded before to internal people, then additional rows were generated for those details, however utilizing the same MessageID. This let me easily track the email flow between people.

Sender

Email address of the Sender of the email, or “External” as a group name if it was sent from outside the company to internal employees.

Recipient

Email address of the Recipient of the email, or “External” as a group name if was sent to someone on the Internet.

Date-Time

This was used for generating the histogram around the outside


Other information that I recorded, that while was not useful for generating the visualization, helped to produce summary tables and raw evidence exports for HR. These columns were:-


Content Type

This was broken into PowerPoint, image or movie.

Src Mailbox

No matter how careful people are at cleaning their own Mailboxes, it only takes one person in the network not to delete emails for everyone involved to be implicated. This was used to identify which Exmerged mailbox the evidence was found in.

Subject

Email Subject line


Once I had all this data, I created a new worksheet called “karyotype”. I think I was lucky that I had a very clear idea about what my final visualization was going to look like, so I could attack the problem of generating the graph in steps. The first step was to generate a graph with all the Users arc’s with the right number of segments in them for the total number of emails sent and/or received. To determine all the “Users” I sorted the first worksheet by Sender+MessageID and recorded a the number of emails different emails sent against the User in the new “karyotype” worksheet. Then I did the same for Recipient+MessageID. Once I had a row for each individual User (plus one for “External” users), I created a third column for Total number of emails.


LABEL

# Sent

#Recv

#Total

User1

5

18

23

User2

1

0

1

User3

0

1

1

External

27

4

31

User4

0

1

1


This became the basis for creating my “karyotype” file. If you review the tutorials that Martin Krzywinski has created for Circos, you will note that the “karyotype” configuration file is defined as:-


Chr – ID LABEL START END COLOR


Therefore my karyotype definition became:


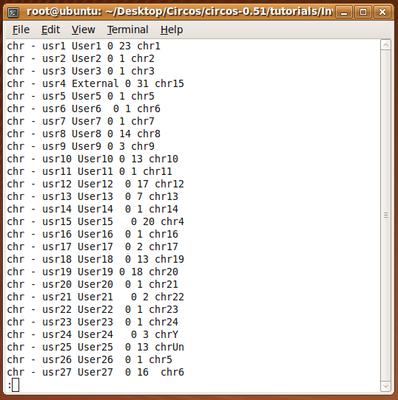
When you download the Circos tarball, there is a subdirectory that contains the configuration files for tutorials called “tutorials/”. When making my graphs, I copied the config files from one of the tutorial directories and placed them into my working subdirectory under “tutorials/” called “Investigation”. The benefit of doing this was that when creating the tutorials, Martin Krzywinski had already defined a number of common configuration files like the colors definitions. It is the in this colors.conf that the RGB for the color labels shown in my karyotype file above are defined.

At this point I tried to generate my first graph. First I had located and copied a copy from one of the tutorials the circos.conf, ticks.conf and ideogram.conf files into my working directory. Using circos command and the configuration files that I created/copied into the tutorial subdirectory I ran the program with in the following way.


Which produced the following visualization.


Once I got to this point, it was just a matter of following the tutorials on banding, linking and using histograms to generate the final visualization. I will walk through each of those steps in my next posting.

In my last blog I introduce the genome visualization tool called Circos created by Martin Krzywinski. In this post I am going to try provide an overview of the Circos tool in such a way that you can safely concentrate on what the genome terminology represents in the configuration files without being concerned about the specific meaning.

On the Circos webpage you will find excellent tutorials that Martin has already created and I have no intention of trying to reinvite the wheel. Instead, I hope to provide you with a type of Rosetta stone that you can reference when reading the tutorials so that you can more easily translate your requirements into the specific configuration changes you need.

At the core of Circos is the karyotype file. This file includes the total data set that you are basing your visualization on. For genetics, the file normally contains all data on the chromosomes, for my email investigation visualization, the karyotype file held the complete data for the 27 users being represented. An alternative data abstract for IT related visualizations may be the results of a traffic capture on a Class C network. In that case, the karyotype would hold each individual IP address and corresponding traffic type (e.g. Web, mail, P2P, FTP …). Do not be worried about having to filter and include only the data that you may want to use while you are still designing the visualization. Circos gives you plenty of flexibility in its configuration files to draw all the data, or only part of the data represented in the karyotype file.


The karyotype configuration file holds the chromosome data;
– Chromosomes would be equivalent to “email Users” in my investigation visualization
– Chromosomes would be equivalent to “IP addresses” in my network traffic example.


The next central term to understand is the ideogram. For Circos, and ideogram is the graphical representation of a chromosome, and potentially its sub-parts (bands). For my inappropriate investigation graph each “User” was represented by an ideogram. Each users ideogram was a different color, and was broken into segments/bands that represented individual emails of interest. In relation to the network traffic example, an ideogram for an IP address (network traffics chromosome) may be represented with different a color for different UDP/TCP ports, or could be shown as all 65535 ports with a single line for active ports.


An ideogram is a graphical representation for a chromosome;
– The ideograms in my investigation visualization were colored different and had bands for individual emails
– In a network traffic visualization the ideogram for an IP address may only represent active ports, or may show all ports with a line showing those with active traffic.


These are the key concepts you need to understand to work get started and work through the tutorials that Martin has already provided on the Circos hompage. In my next posting I will explain the configurations I used to generate the image I presented in my first blog on Circos.